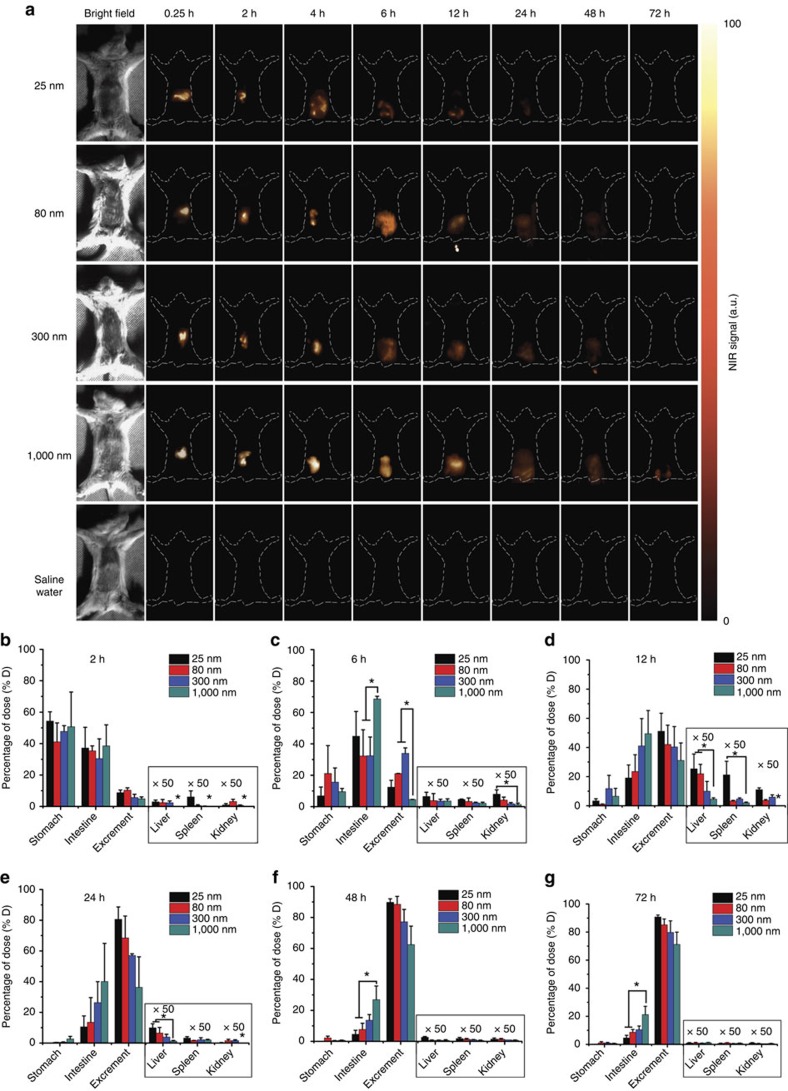
Figure 4. In vivo NIR bioimaging of the GI tract with different sized microcarrier gavaging.
(a) In vivo NIR bioimaging of mice at different times after oral gavaging with different sized particles (25, 80, 300 and 1,000 nm) and saline water as the negative control. All images were taken by an InGaAs NIR CCD camera under 808-nm laser excitation (0.2 W cm−2). Representative images are for n=3 per group. (b–g) Biodistribution results determined by ICP measurements of the particles in various organs (stomach, intestine, liver, spleen and kidney) and excrement at different times after oral gavaging. Mean±s.d. for n=3 (*P value<0.05).

