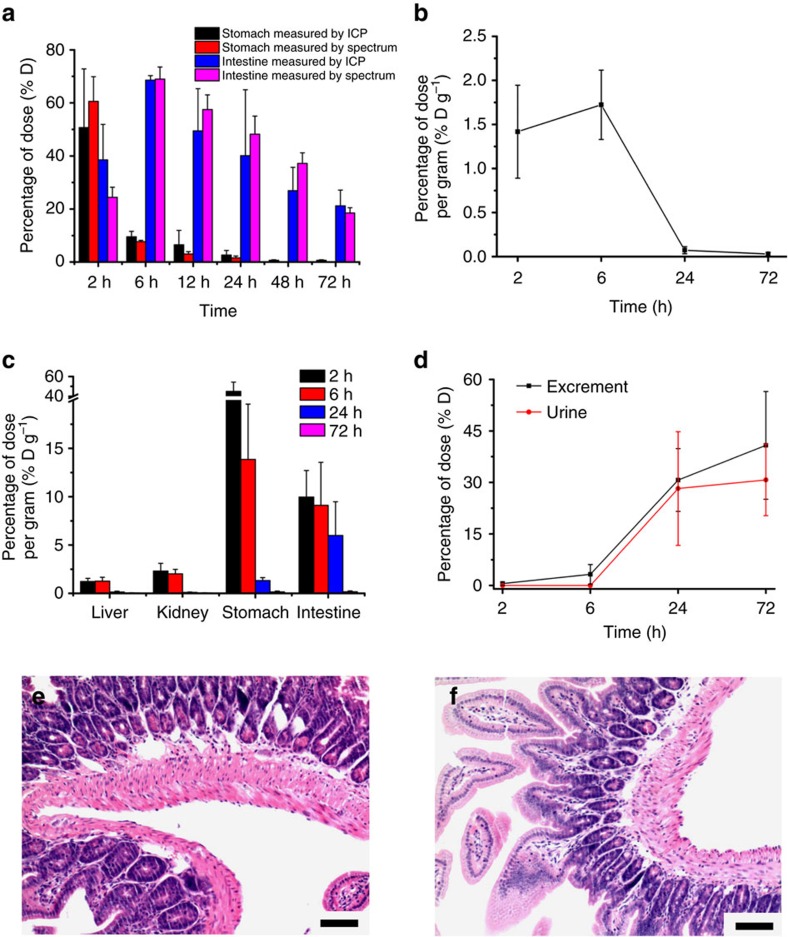
Figure 5. Pharmacokinetics of BSA and toxicity evaluation of the microcarriers.
(a) Investigation of the BSA pharmacokinetic results (stomach and intestine) by ICP and NIR imaging measurements, respectively (P>0.05). Herein, 1,000-nm microcarriers were used as an example. (b–d) Time-dependent plasma concentration (b) tissue distribution (c) and cumulative excretory amounts (d) of 125I-BSA in mice. (e,f) H&E-stained intestine sections of mice after seven days of receiving (e) microcarriers (50 mg kg−1) and (f) saline water daily. All treatments were given via a daily oral gavage. Mean±s.d. for n=3. (e,f) Scale bars, 100 μm.

