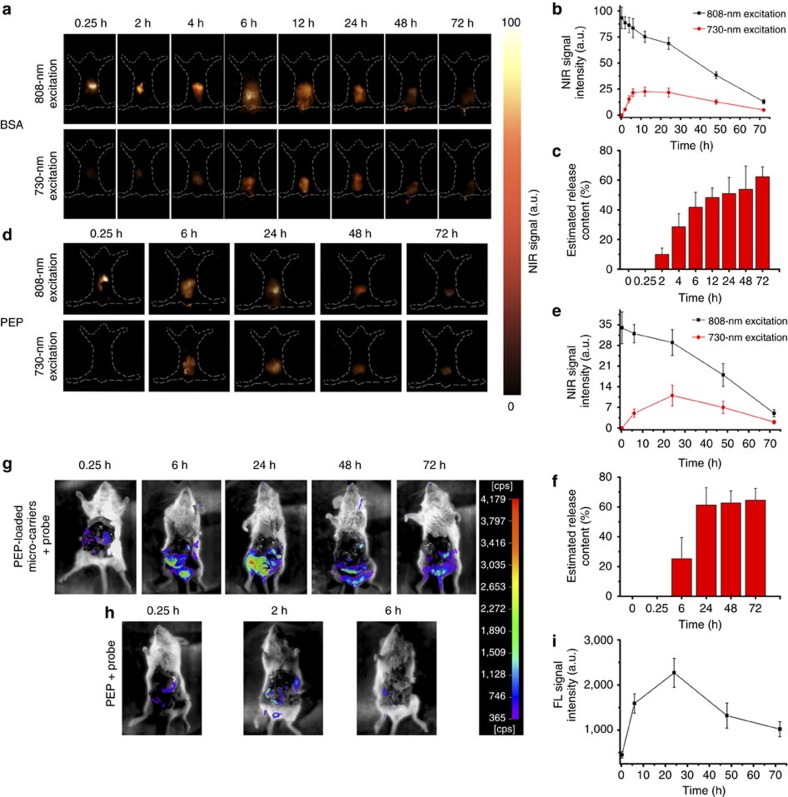
Figure 6. In vivo protein release and activity evaluation.
(a) NIR bioimaging of mice at different times after orally gavaging BSA–NPTAT-loaded microcarriers under 730-nm or 808-nm excitation. (d) NIR bioimaging of mice at different times after orally gavaging PEP–NPTAT-loaded microcarriers under 730-nm or 808-nm excitation. (g,h) In vivo bioimaging of mice after gavaging with PEP–NPTAT-loaded microcarriers and a peptide probe (g) and PEP molecules and a peptide probe (h); 405 nm was used as the excitation source. Representative images are for n=3 per group. (b,e,i) Corresponding signal intensity curves of (a,d,g) respectively. (c–f) In vivo release percentages (Q(τ)) of BSA–NPTAT (c) and PEP–NPTAT (f) from microcarriers calculated using equation (1). Mean±s.d. for n=3.

