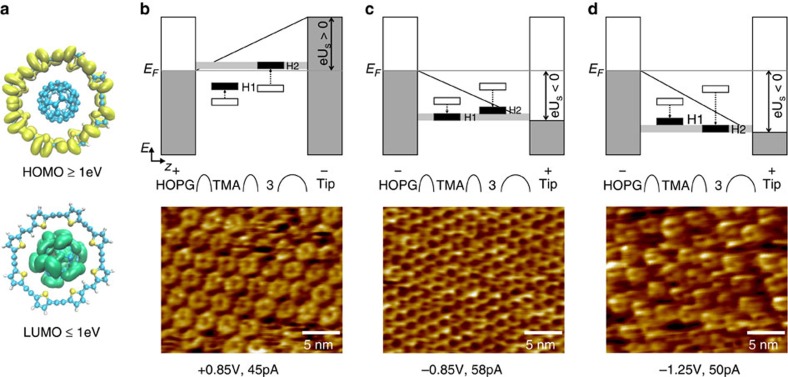
Figure 2. Bias set-point imaging.
(a) Isosurfaces showing the electron probability distribution 1 eV below and above the HOMO and LUMO of the complex 3, respectively. (b) At positive substrate bias, the resonant tunnelling is achieved through the HOMO of 3 (H2), which is symmetrically distributed in the macrocycle. The height image shows below at Us=+0.85 V, It=45 pA. (c) By switching to negative substrate bias, the resonant tunnelling occurs through the HOMO of the underneath TMA (H1), as the image below at Us=−0.85 V, It=58 pA. (d) Lowering the negative substrate bias gives access again to H2, Us=−1.25 V, It=50 pA. The tunnelling does not occur through the LUMO of 3 (localized in the C60) because of the closer proximity of both HOMOs to the Fermi level of the HOPG.

