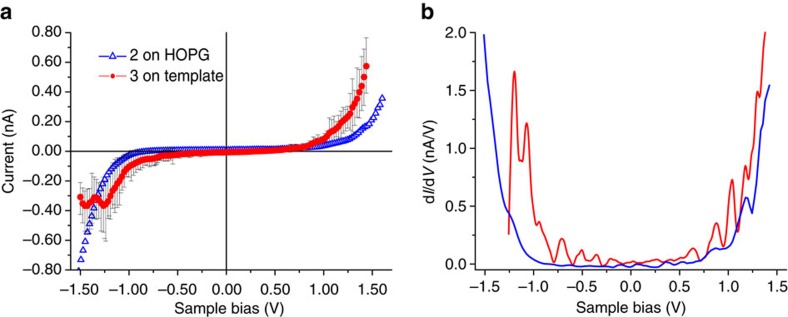
Figure 3. STS of 2 and templated monolayer of 3.
(a) Average I–V characteristics over twenty measurements of a monolayer of templated 3 (red circles, STS conditions Us=+0.94 V and It=50 pA), including error bars (see Supplementary Fig. 6a for scattered data). For comparison the average I–V trace of fifteen measurements of 2 on HOPG was measured too (blue triangles, STS conditions Us=−1.0 V and It=80 pA). For the templated monolayer of 3 the current saturates below −1.2 V, not the case for 2. (b) Differential conductance (dI/dV) versus sample bias, where the saturation effect is evident below −1.2 V.

