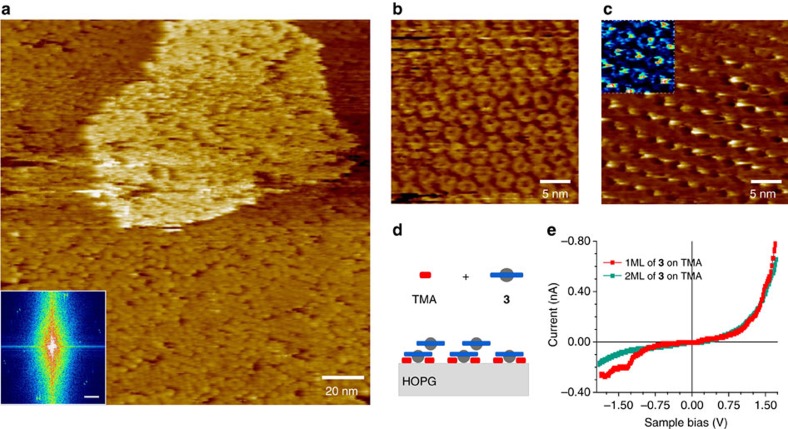
Figure 4. Growth of a second monolayer of 3.
(a) STM height image of a templated bilayer of 3 in heptanoic acid solution. Measuring conditions Us=+1.05 V, It=42 pA. Two different unit cells can be identified from the fast fourier transform in the inset, the scale bar is 1/10 nm. STM height image at +1.05 V (b) and −1.05 V (c) of a templated bilayer (2ML) of 3 in heptanoic acid solution. The unit cell measures a=(2.85±0.04) nm, b=(2.84±0.04) nm, θ=(61±1)°. An inset in c is showed in a different contrast to highlight the image of the macrocycles of the first templated monolayer (1ML). We attribute the bright spot to the C60 of the layer on top. (d) Scheme of the suggested arrangement of the first and second layer of 3. C60 of the second layer lies on the rim of the first one. (e) I–V characteristic over fifteen measurements through 1ML and 2ML of 3 (STS conditions Us=+0.95 V and It=51 pA) (see Supplementary Fig. 9 for scattering of data).

