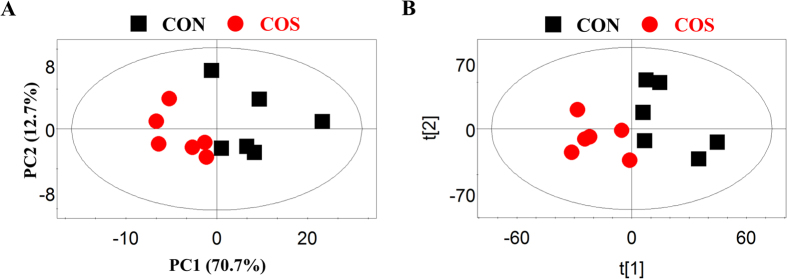
Figure 3.
PCA (R2X = 83.4%, Q2 = 0.570; (A)) and PLS-DA (R2X = 58.9%, R2Y = 0.7867, Q2 = 0.417; (B)) score plots on the basis of the 1H NMR spectra of amniotic fluid samples from COS-treated (red circles) and CON groups (black squares). PCA, principal component analysis. PLS-DA, partial least squares discriminant analysis. CON is a corn–soybean basal diet and COS is the basal diet supplemented with 100 mg/kg chitosan oligosaccharide.

