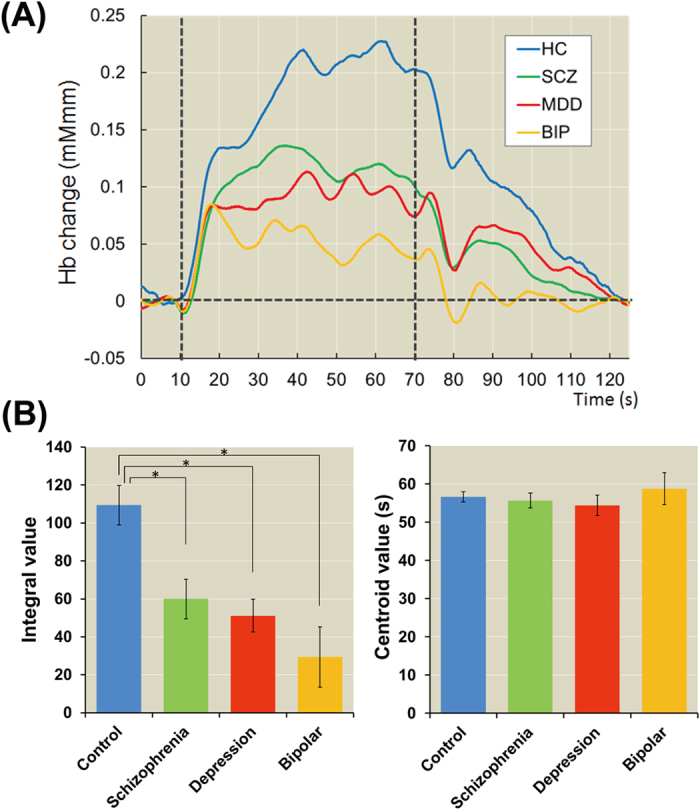
Figure 2. Differences in the integral and centroid values among four patient groups.

(A) Time course of frontal region hemodynamic responses among the four diagnostic groups. (B) Means and standard errors of the integral and centroid values among the four groups. HC, healthy controls; SCZ, schizophrenia; MDD, major depressive disorder; and BIP, bipolar disorder. *post hoc p < 5.00 × 10⁻².
