
Figure 3. Sensing surface optimization. Blue bars indicate EIS responses of AptaFET to 500 nM of TFV exploiting various aptamer to MCH ratios.
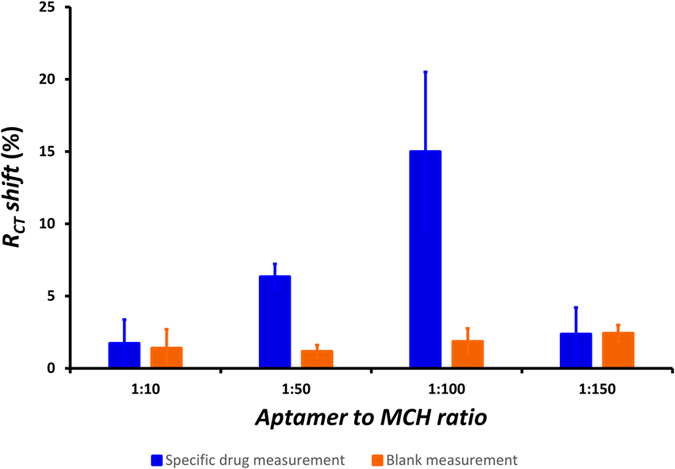
Highest RCT shift for 1:100 ratio. Error bars in this and following Figures represent the standard error of triplicate measurements carried out on three electrodes.