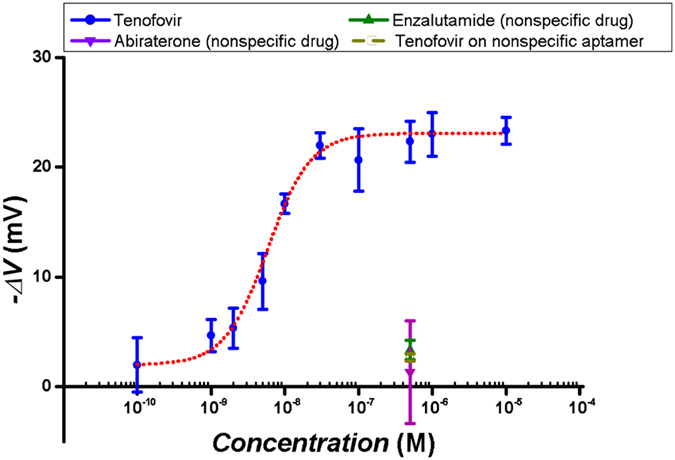
Figure 4. Dose-response curve of AptaFET biosensor.

Specific response (blue points) fitted to hill function with linear range between 1 nM and 100 nM, and EC50 of 5.8 ± 0.5 nM. Responses related to non-specific drugs and non-specific aptamers as negative controls in purple green and yellow colour.
