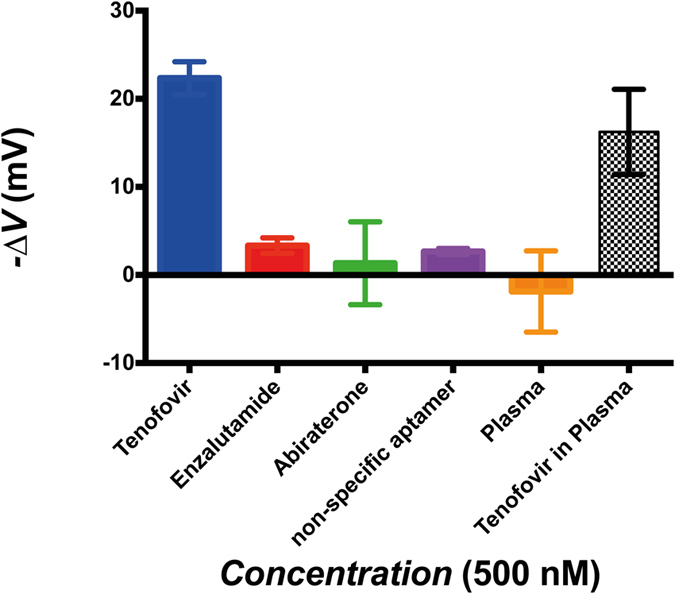
Figure 5. AptaFET response comparison. Response of biosensor to TFV in PBS (blue), in human plasma (black patterned).

Non-specific response to negative controls: Enza (red), Abi (green) and blank blood plasma (orange). Non-specific response of TFV and PSA-aptamer interaction (purple bar). All target concentrations are 500 nM.
