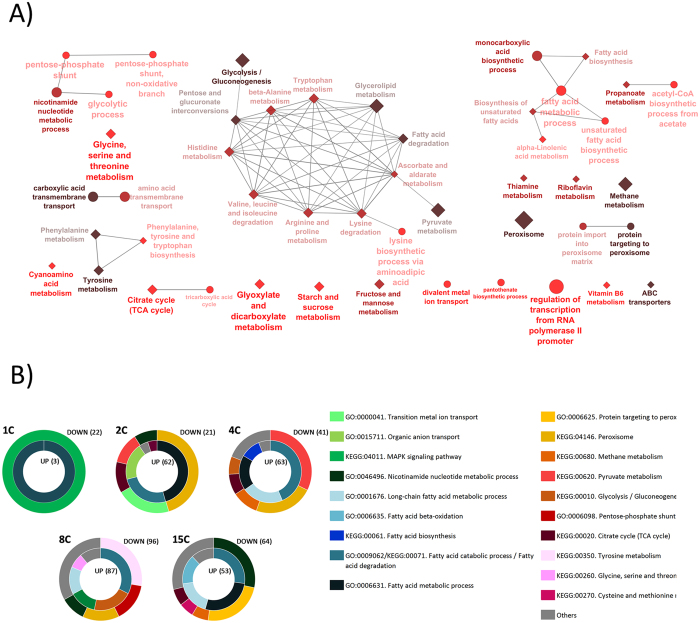
Figure 3. Functional analysis of regulated genes.
(A) Network representation of enriched functional categories amongst ROL expressing strains, generated by ClueGO. Node size reflects the number of genes associated to a term whereas the gradient colour indicates the significance level (Bonferroni-Hochberg correction). GO and KEGG databases were used, represented as circles and diamonds, respectively. Individual networks are grouped by metabolic pathways. (B) Doughnut representations of main functional categories by strain. Outer and inner circles refer to down- and upregulated genes, respectively. Number in brackets indicates total amount of annotated genes in each condition.

