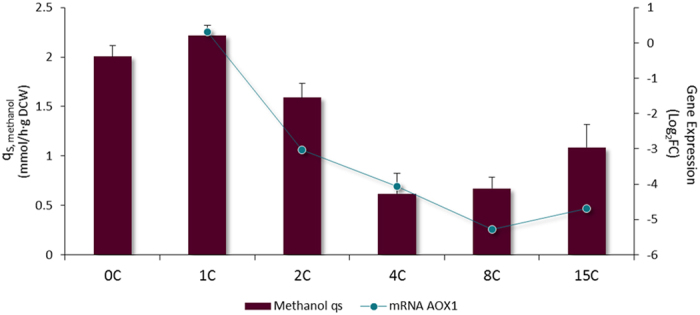
Figure 6. Methanol consumption rate is related to alcohol oxidase expression.

In bars, methanol consumption rate of multicopy strains growing in chemostat cultures. Line graph represents the AOX1 transcript levels measured in the microarrays, comparing to the reference strain 0C. Error bars represent the standard deviation between three independent experiments.
