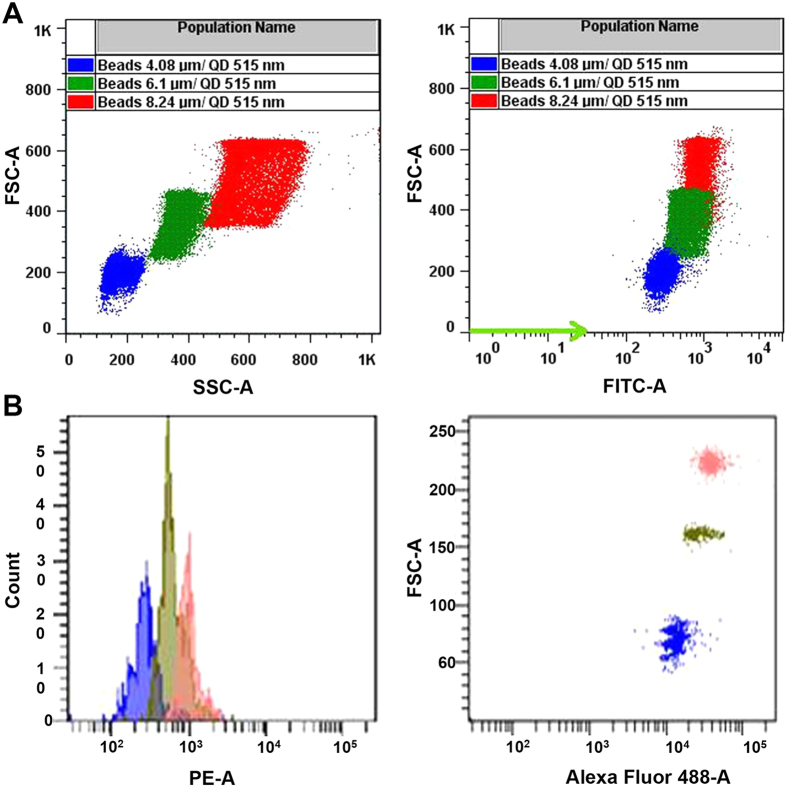
Figure 1. Flow cytometry analysis of quantum dot–encoded microspheres.
(A) Flow cytometry analysis of three populations of QDEM with sizes of 4.08 μm (blue), 6.1 μm (green), and 8.24 μm (red). (B) Representative flow cytometry images obtained by means of the QDEM-based 3-plex immunoassay for lung cancer markers. FSC-A, forward light scattering; SSC-A, side light scattering; PE-A, phycoerythrin channel of flow cytometer.

