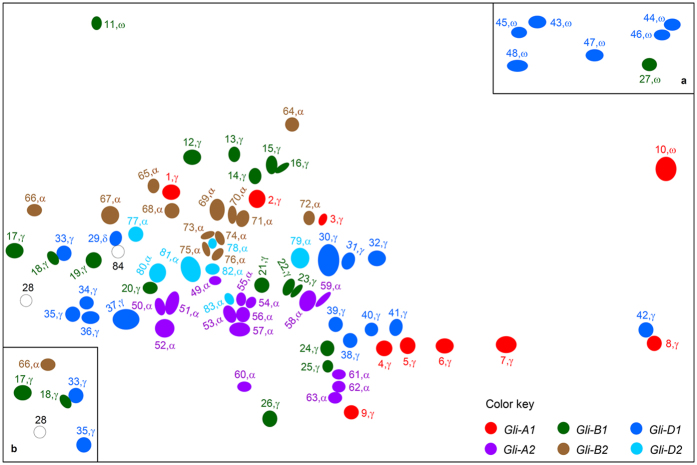
Figure 1. A schematic representation of the 2-DE spots resolved for the gliadin extract of Xiaoyan 81 mature grains.
The spots were numbered (1 to 84) and the types of gliadins (α, γ, δ or ω) to which they belonged were indicated. They were also color-coded to indicate the control by individual Gli loci (i.e., Gli-A1, -B1, -D1, -A2, -B2 and -D2), which was determined by comparing the 2-DE data of Xiaoyan 81 with those of the six Gli locus deletion lines (DLGliA1, DLGliB1, DLGliD1, DLGliA2, DLGliB2 and DLGliD2). The majority of the spots were well separated by IEF under pH 6–11, but those shown in insets a and b were better resolved by IEF under pH 3–10 (Figure S12). Two spots (28 and 84) could not be resolved because both were mixtures of different types of gliadins. The image was prepared based on the data of 25 independent 2-DE runs (seven for Xiaoyan 81 and three for each of the six deletion lines) and the MS/MS analysis results of the 2-DE spots.

