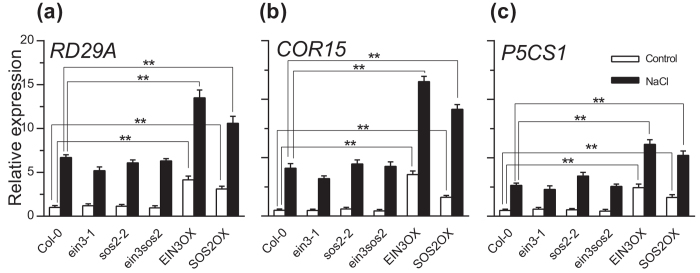
Figure 6. EIN3 and SOS2 activate stress-responsive genes under salt stress.
(a–c) The expression of RD29A (a), COR15 (b) and P5CS1 (c) in Col-0, ein3, sos2, ein3 sos2 mutants and EIN3/SOS2 overexpression lines before and 2 hours after treatment by 150 mM NaCl. Values are means ± SD (n = 3). **Indicates significant difference at p = 0.01 by t-test. EIN3OX and SOS2OX are EIN3 and SOS2 overexpression lines, respectively.

