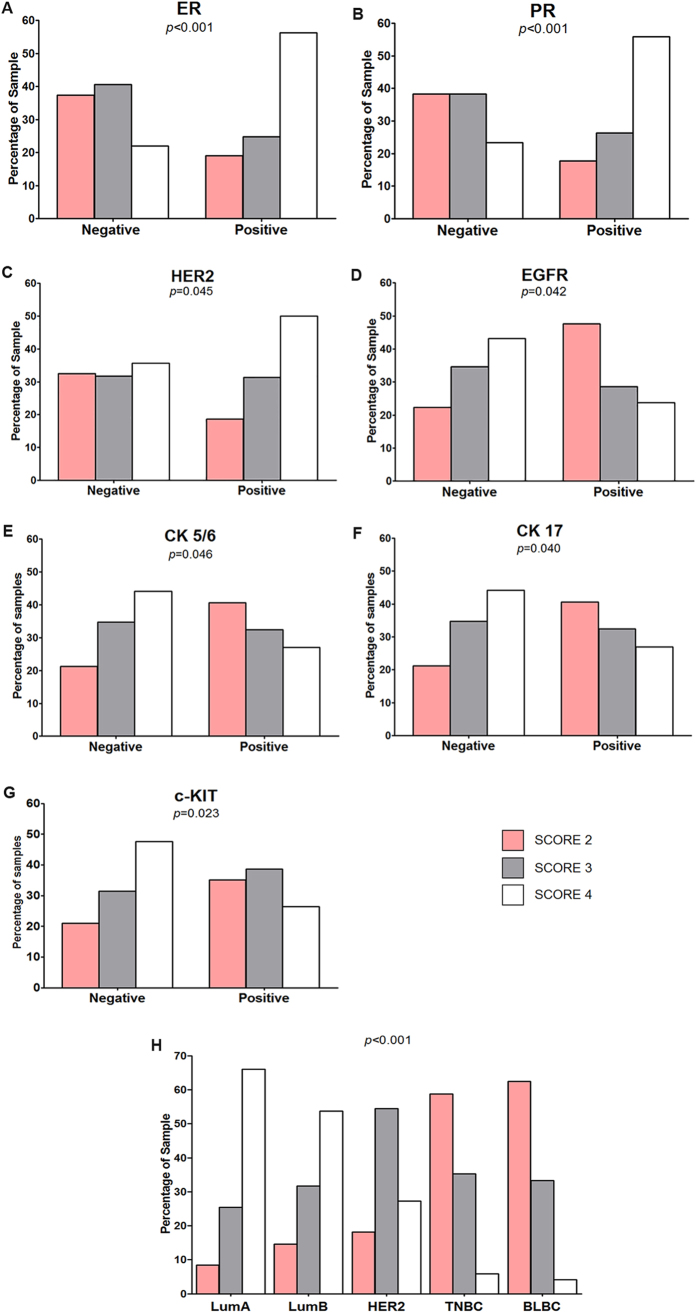
Figure 4. Correlation between the ADAM33 Score and biomolecular markers.
Percentage of patient samples that showed a correlation between the ADAM33 score and (A) a ER (p < 0.001); (B) PR (p < 0.001); (C) HER2 (p = 0.045); (D) EGFR (p = 0.042); (E) CK 5/6 (p = 0.046); (F) CK17 (p = 0.040); (G) c-KIT (p = 0.023) and (H) tumor subclasses (p < 0.001).

