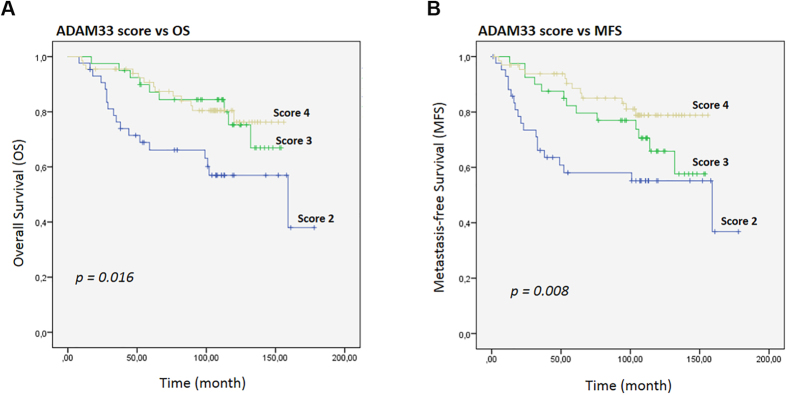
Figure 5. Kaplan-Meier curves for the time to breast cancer progression according to the ADAM33 Score.
(A) Kaplan-Meier estimates are shown for overall survival and (B) metastasis-free survival using the ADAM33 scores. Symbols on the graph lines represent censored data; p values are given for log-rank tests.

