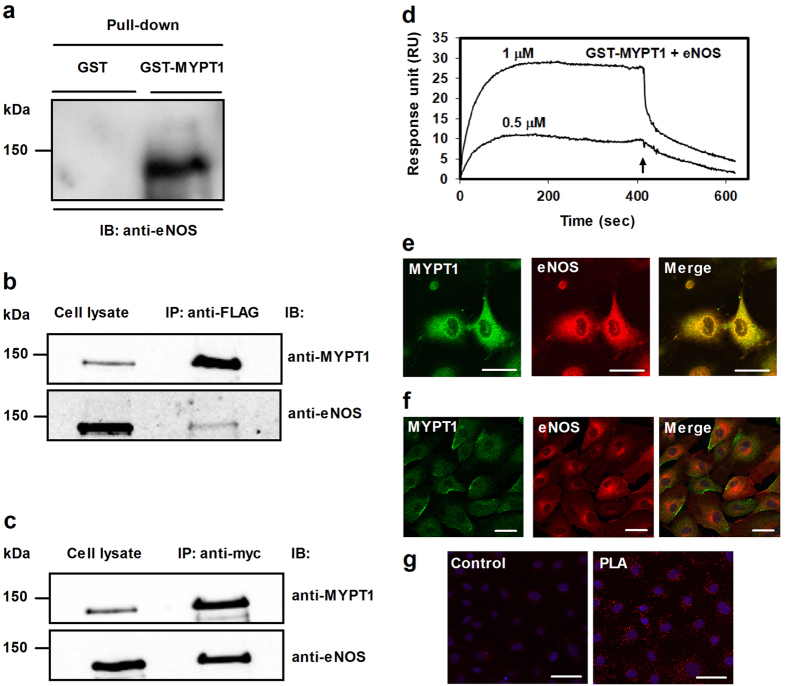
Figure 1. Interaction of eNOS with MYPT1.
(a) Identification of eNOS in GST (control) or GST-MYPT1 pull-down fractions of HUVEC lysate using glutathione-Sepharose to isolate the interacting proteins. (b,c) Co-immunoprecipitation of overexpressed FLAG-MYPT1 and c-myc-eNOS in tsA201 cell lysates using anti-FLAG (b) or anti-c-myc-agarose (c) beads to isolate the protein complexes. Cropped images of representative Western blots are shown in (a,b) and (c). Uncropped, full-length blots are presented in Supplementary Information in Fig. S1. (d) Binding of eNOS to full-length GST-MYPT1 immobilized to anti-GST coupled CM5 sensor chips. Purified c-myc-eNOS at 0.5 or 1 μM concentrations in running buffer (10 mM Hepes (pH 7.4), 0.15 M NaCl, 3 mM EDTA, and 0.005% (v/v) Surfactant P20) was injected over the GST (control) and GST-MYPT1 surfaces at 0 time and the association phase of the interaction was monitored for 7 min. The dissociation phase in running buffer without c-myc-eNOS was started (at 7 min as indicated by an arrow) and recorded for 3.5 min. The surface (with immobilized recombinant GST) was treated identically to the GST-MYPT1 surfaces to determine unspecific binding which was subtracted from the data obtained with the GST-MYPT1 surfaces. Representative sensorgram of two independent experiments are shown. (e) Co-localization of MYPT1 (green) and eNOS (red) in human pulmonary artery endothelial cells (HPAEC). Images were captured by confocal microscopy. Merged images of eNOS and MYPT1 are also shown. Scale bar, 10 μm. (f) Co-localization of MYPT1 (green) and eNOS (red) in BPAECs. Images were captured by confocal microscopy and merged images are shown. Scale bar, 50 μm. (g) MYPT1 and eNOS interactions were assessed by Duolink proximity ligation assay (PLA) as described in Materials and Methods. For the control only the secondary antibodies were added. Red fluorescence indicates interacting MYPT1-eNOS complexes. Scale bar, 50 μm.

