
Figure 5. The effect of PKC activation and phosphatase inhibition on the level of MYPT1pThr696 and eNOSpThr497.
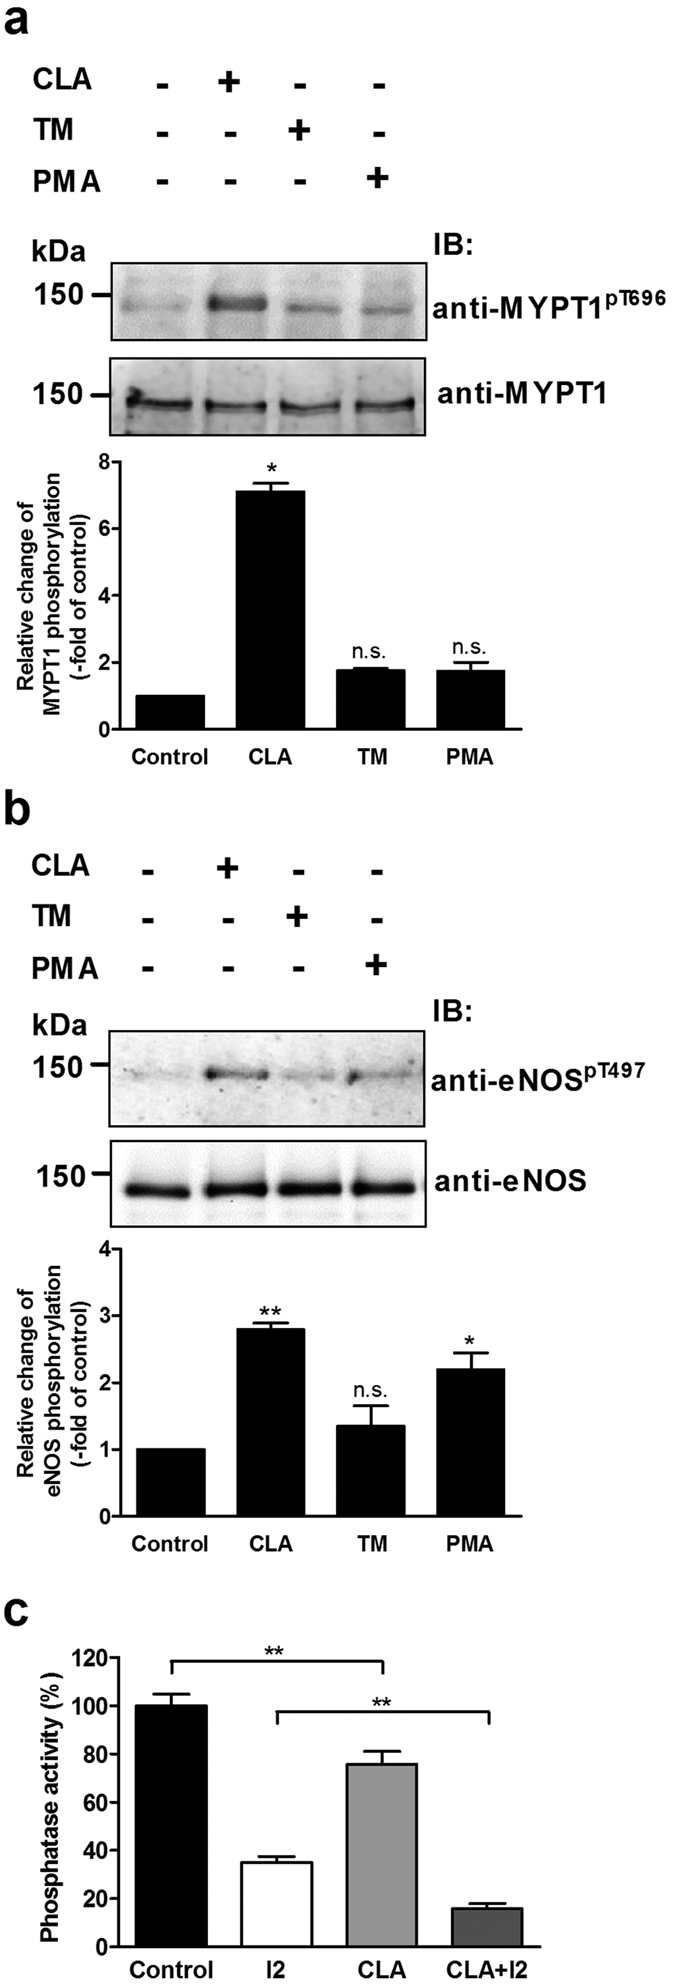
BPAECs cells were treated with 10 nM CLA, 1 μM TM or 100 nM PMA for 30 min and the level of MYPT1pThr696 (a) and eNOSpThr497 (b) was monitored by Western blotting (upper panel) and quantified by densitometry (bar graphs). Cropped images of representative Western blots are shown in (a) and (b). Uncropped, full-length blots are presented in Supplementary Information in Fig. S8. Densitometric analysis of blots from 3–4 independent experiments was carried out (means ± SEM, n.s.: not significant, *p < 0.05, **p < 0.01, ***p < 0.001, compared to control. One-way ANOVA, Newman-Keuls post-hoc testing). (c) BPAECs cells were treated with 10 nM CLA and the phosphatase activity in the lysates of untreated (control) or CLA treated cells was determined in the absence or the presence of 2 μM inhibitor-2 using 32P-MLC20 as substrate. Data represent means ± SEM, **p < 0.01 (n = 3), One-way ANOVA, Newman-Keuls post-hoc testing.