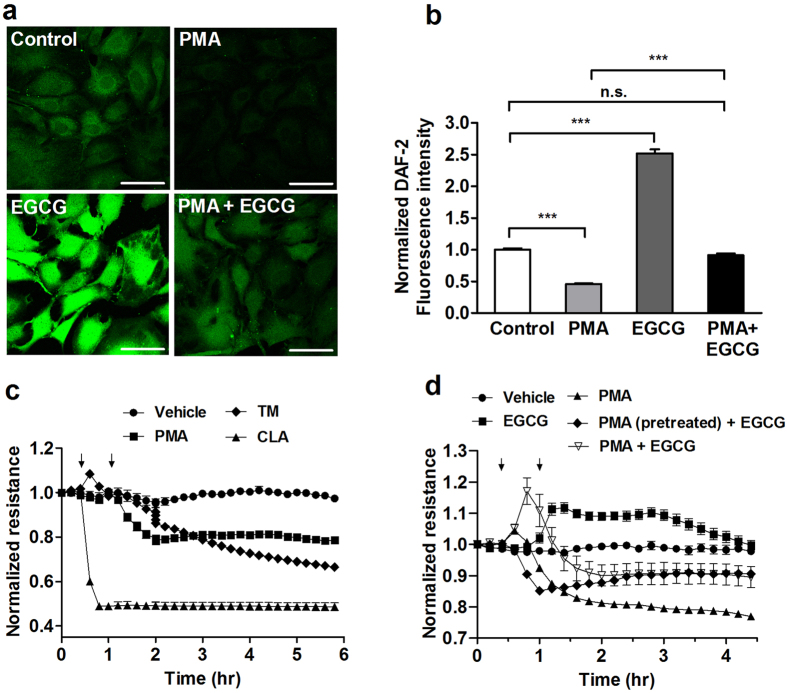
Figure 7. Effect of PKC activation and phosphatase inhibition/activation on NO production and the transendothelial electrical resistance (TER) of BPAECs.
(a) BPAECs were grown on coverslips in serum free medium and loaded with the reaction mixture including DAF-2 DA for 60 min. Next, coverslips were incubated with the PKC activator PMA (100 nM), EGCG (20 μM) and the combination of PMA and EGCG in parallel with the non-treated coverslips (control) for 60 min. Scale bar, 50 μm. (b) Single cell fluorescence activity determined by ImageJ after different treatments indicated in (a). Results of single cell values (120–153 individual cells) of two independent experiments are shown in means ± SEM. (n.s.: not significant, ***p < 0.001, One-way ANOVA, Newman-Keuls post-hoc testing). (c) BPAECs grown in serum free medium in ECIS arrays were untreated (control), or treated with PMA (100 nM), 10 nM CLA or with 1 μM tautomycin (TM) for 30 minutes. (d) BPAECs cells grown on ECIS arrays were treated with vehicle, 20 μM EGCG, 100 nM PMA or with 100 nM PMA and 20 μM EGCG, added together or EGCG was added 30 minutes after PMA. Time points of treatment with effectors are indicated by arrows. Normalized TER values were expressed as mean ± SEM of 3–4 individual experiments.

