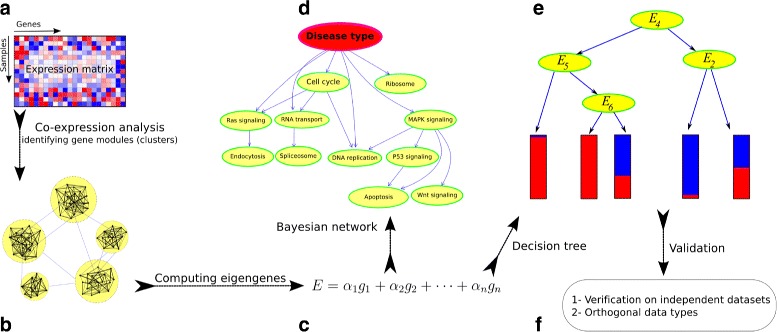
Fig. 1.

Schematic view of the Pigengene methodology. a The input is a gene expression profile (matrix) provided by RNA-Seq or microarray. b The coexpression network is built according to the correlation between gene pairs. c For each module, an eigengene is computed as a weighted average of the expression of all genes in that module. d Optionally, a Bayesian network is fitted to the eigengenes to delineate the relationships between modules. e A decision tree is fitted to the eigengenes and used for classification. f The results are validated on independent expression datasets and also evaluated using other data types. For instance, DNA methylation profiles can confirm gene-silencing events [43]
