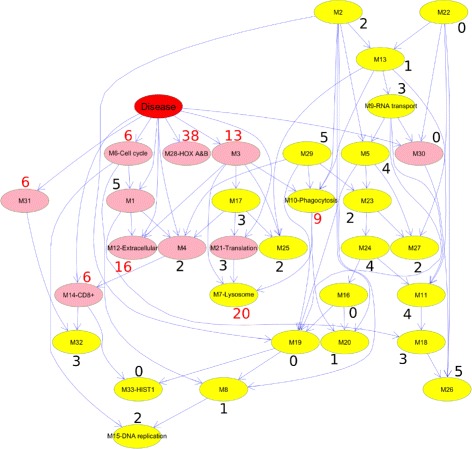
Fig. 3.

The Bayesian network fitted to the eigengenes. Each node represents an eigengene of a module. The arcs model the probabilistic dependencies between the modules [86]. The “Disease” node is set to 1 for AML and 0 for MDS, and its children are highlighted in pink. Some modules are labeled based on their association with a biological process or a pathway (Additional file 2: Table S2). We used Miller et al., survey to identify the 427 genes reported to be associated with AML in at least three studies [81] (Additional file 3: Table S1). For each module, the percentage of AML-related genes is noted. The percentages that exceed 5% are shown in red. As expected, most of the children of Disease are enriched in genes known to be associated with AML. Specifically, the average of percentages over the children of the Disease node is 10%, which is twice the average of all modules (5%). Also, hypergeometric tests showed that modules 3, 7, 12, and 28 are statistically enriched with AML-related genes (Bonferroni adjusted p-values are 10−7, 10−13, 10−3, and 10−8, respectively). All four of these modules are descendants of the Disease node
