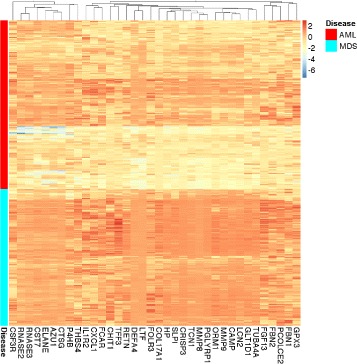
Fig. 5.

Comparing the expression of extracellular region genes. Each column shows the expression of a gene from the extracellular matrix module that is associated with the “extracellular region” in the cellular component category of Gene Ontology (GO). For clarity, each column is scaled by subtracting its mean and dividing by its standard deviation. Each row corresponds to a sample from the MILE dataset. These 36 genes are generally underexpressed in AML compared to MDS. The expression of all 133 genes in the extracellular matrix module have a similar pattern (Additional file 1: Figure S6)
