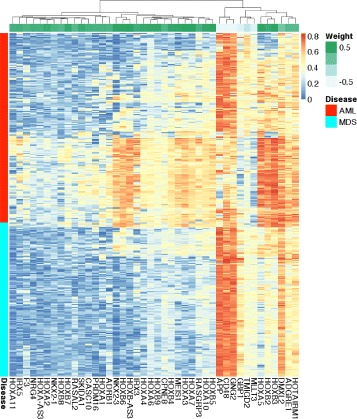
Fig. 6.

Comparing the expression of genes in the HOXA&B module. Expression of every member of HOXA&B module is shown in one column. Each row corresponds to a sample from the MILE dataset. The majority of HOXA and HOXB genes in this module are not expressed in MDS. Their expression in AML are variable indicating the heterogeneity of the disease. They anticorrelate with GNG2, CD48, and APP, which have the least negative weight (-0.7) in the corresponding eigengene (the green strip at the top). These patterns are similar in the BCCA dataset (Additional file 1: Figure S7)
