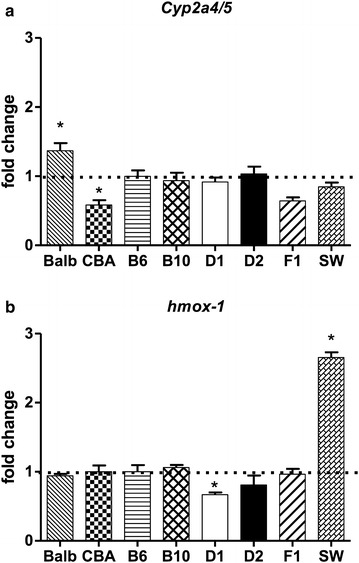
Fig. 2.

Constitutive levels of Cyp2a4/5 and hmox-1 mRNA in the liver of mice from different strains. a (upper panel) expression of Cyp2a4/5. b (lower panel) expression of hmox-1. Relative quantification of mRNA was made by qPCR taking C57BL/6 liver sample as the reference (*P < 0.05, Kruskal–Wallis test followed by Mann–Whitney U test with Bonferroni’s correction). N = 6 per mouse strain
