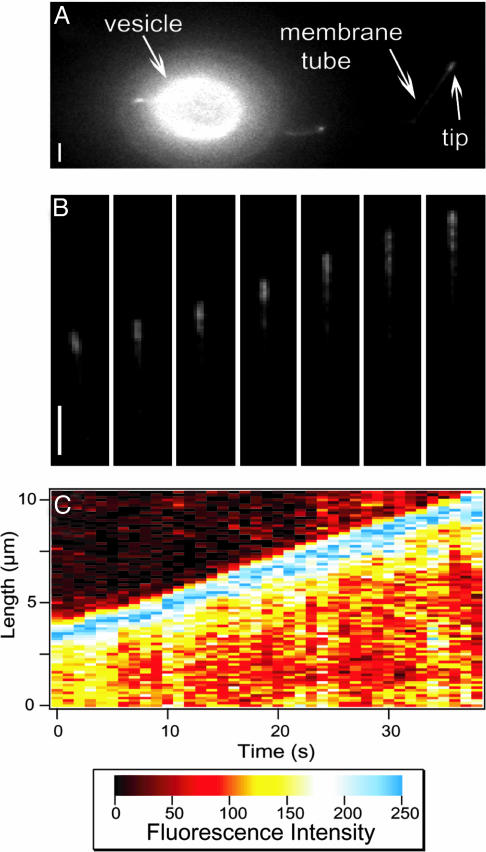
Fig. 1.
Membrane tube growth. (A) Fluorescence image showing a vesicle, a tube, and the accumulation of motors at its tip. The vesicle contains 0.1 mol% DHPE-Biot-Rhod. (Bar, 2 μm.) (B) Time sequence images of a growing tube (one image per 5 s). It corresponds to the membrane tube in A. The tube grows along a MT with a velocity of ≃0.16 μm/s. (Bar, 2 μm.) (C) Fluorescence intensity plot as a function of position along the tube path and time, for the same tube as in B.

