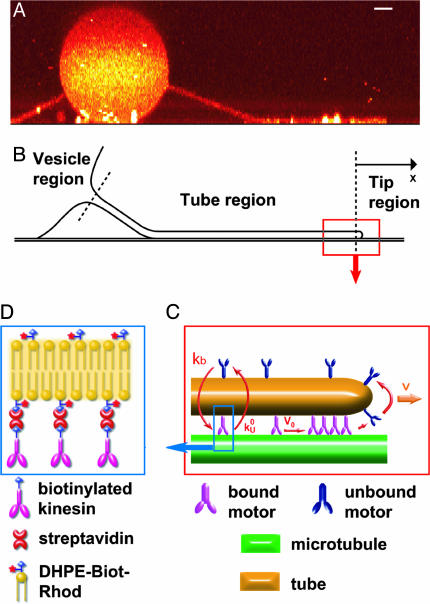
Fig. 2.
Sketch of the main features of the system. (A) Confocal side-view image of a membrane tube representing the typical geometry of the system and suggesting the natural regions dividing it. The binding sites of motors were not specifically labeled. (Bar, 2 μm.) (B) Schematic representation of the different regions (vesicle, tube, and tip). (C) Sketch of the tube-tip boundary and tip region representing the accumulation process at the tip (V < V0). V is the velocity of the tube and of bound motors at the tip; V0 is the zero-load velocity of bound kinesins. k0u and kb are the unbinding rate at zero load and the binding rate of kinesins onto MTs, respectively. We schematically represent the accumulation of motors at the tip. (D) Binding a biotinylated kinesin to a rhodamin-labeled biotinylated lipid (DHPE-Biot-Rhod) through a streptavidin molecule.

