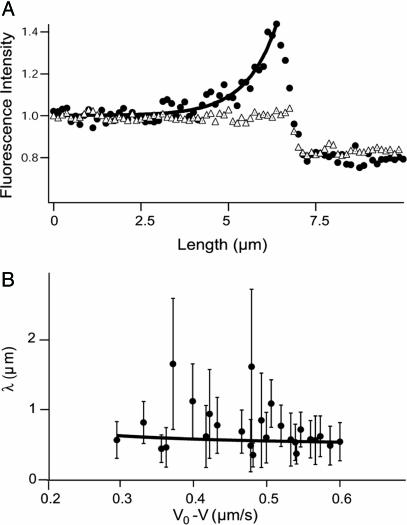
Fig. 4.
Quantitative analysis of the motor distribution. (A) Fluorescence intensities along the tube path normalized by the average intensity far from the tip. Filled circles, the binding sites of motors were labeled with DHPE-Biot-Rhod; triangles, membrane was labeled with BODIPY PC; the binding sites of motors were not specifically labeled (control experiment); solid line, exponential fit of the intensity profile represented by the circles. The best fitting value for the characteristic length λ is 1.0 μm. (B) Characteristic length λ as a function of V0 – V for 370 measurements from 20 different tubes. Each point corresponds to the average λ (and associated standard deviation) for measurements with the same velocity. The continuous line corresponds to the one parameter weighted nonlinear fit by using Eq. 7,  = 0.42 s–1 (20) and V0 = 0.6 μm/s. Each weight is given by the normalized inverse of the variance associated to that point. The only fit parameter is kb/D and its best fitting value is 4.7 ± 0.5 μm–2. Using D = 1.0 ± 0.5 μm2/s leads to kb = 4.7 ± 2.4 s–1. We have further checked that reasonable variations of k0u do not affect significantly this value.

