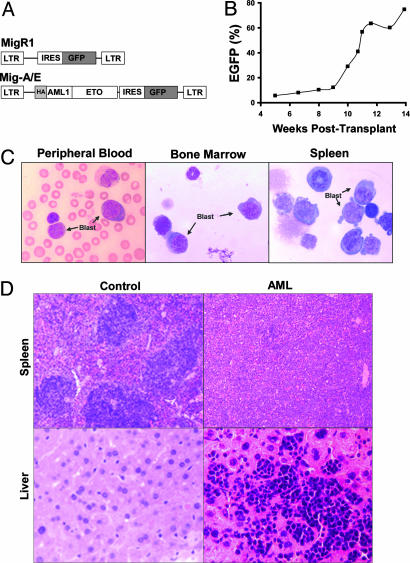
Fig. 1.
Detection of AML1-ETO-expressing cells and analysis of leukemia. (A) The structure of MigR1 and Mig-A/E retroviruses. (B) The percentage of GFP+ (AML1-ETO-expressing) cells in the peripheral blood was monitored regularly by flow cytometry. (C) Morphological analysis of hematopoietic cells from the AML mouse. Blood smear and cytocentrifugation of bone marrow and spleen cells were stained by Wright–Giemsa staining. (D) Histological analysis of spleens and livers of control and disease mice. The tissue sections were stained by hematoxylin and eosin.

