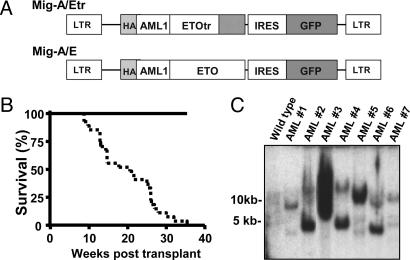
Fig. 3.
The C-terminal truncated AML1-ETO causes a rapid onset of AML. (A) Structure of Mig-A/E and Mig-A/Etr retroviruses. (B) Kaplan–Meier survival curves of MF-1 mice transplanted with retrovirus-infected fetal liver cells. The solid line represents mice that received MigR1 vector-infected cells (n = 12) or Mig-A/E-infected cells (n = 14). The dotted line represents mice that received Mig-A/Etr-infected cells (n = 27). (C) Southern blot analysis of the clonality of retroviral integration in seven leukemic mice with AML1-ETOtr. We analyzed 10 μg of spleen genomic DNA from each sample, as shown in Fig. 2 A.

