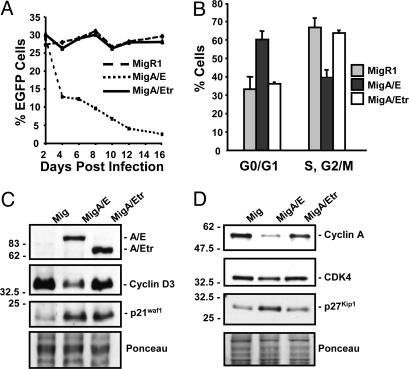
Fig. 4.
Differential effect of AML1-ETO and AML1-ETOtr on cell cycle and cell-cycle proteins. (A) At 2 days after retroviral infection, the percentage of EGFP+ K562 cells was adjusted to the same level among MigR1-, MigA/E-, and MigA/Etr-infected samples with K562 cells that also went through the infection procedure in the absence of viral supernatant. The percentage of EGFP+ cells was analyzed by fluorescence-activated cell sorting. (B) Cell-cycle analyses on sorted EGFP+ cells. The cell-cycle distribution was determined by propidium iodide staining. (C) Western blot analysis of cyclin D3 and p21WAF1/CIP1 expression. Protein samples (20 μg) prepared from sorted EGFP+ cells were used in Western blotting and probed with HA, cyclin D3, and p21WAF1/CIP1 antibodies. Ponceau staining of the blot showed the relative amount of proteins in each lane. All assays were repeated at least three times with similar results. (D) Analysis of cyclin A, CDK4, and p27KIP1 by Western blotting using samples as prepared in A.

