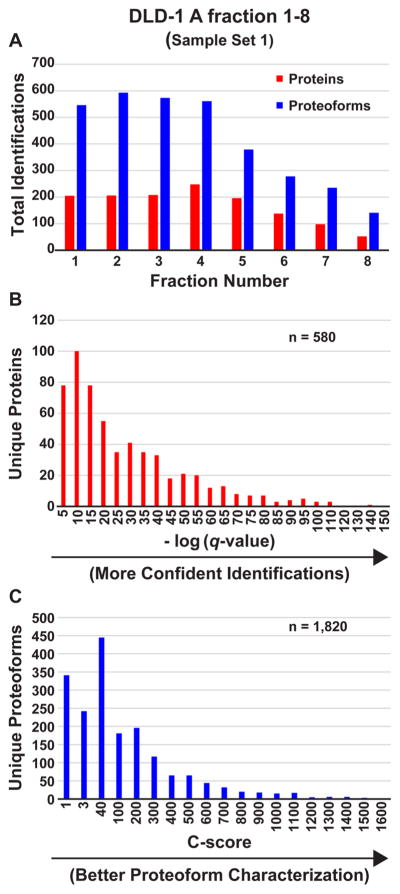
Figure 1.
Protein and proteoform identification and scoring metric distributions. Data from Sample Set 1 (DLD-1 A). (A) Total number of proteins (red) and proteoforms (blue) identified at 1% FDR per single LC–MS/MS injection of each of the eight 10% GELFrEE fractions of whole cell lysate. (B) −log (q-value) distribution for the 580 unique proteins (unique UniProt accession numbers) identified at 1% FDR. (C) C-score distribution for the corresponding 1820 unique proteoforms. For (B) and (C), each bin comprises the sum of identifications with scores between that bin and the one to the left, save for the lowest, which comprises the sum of the identifications between that number and zero.

