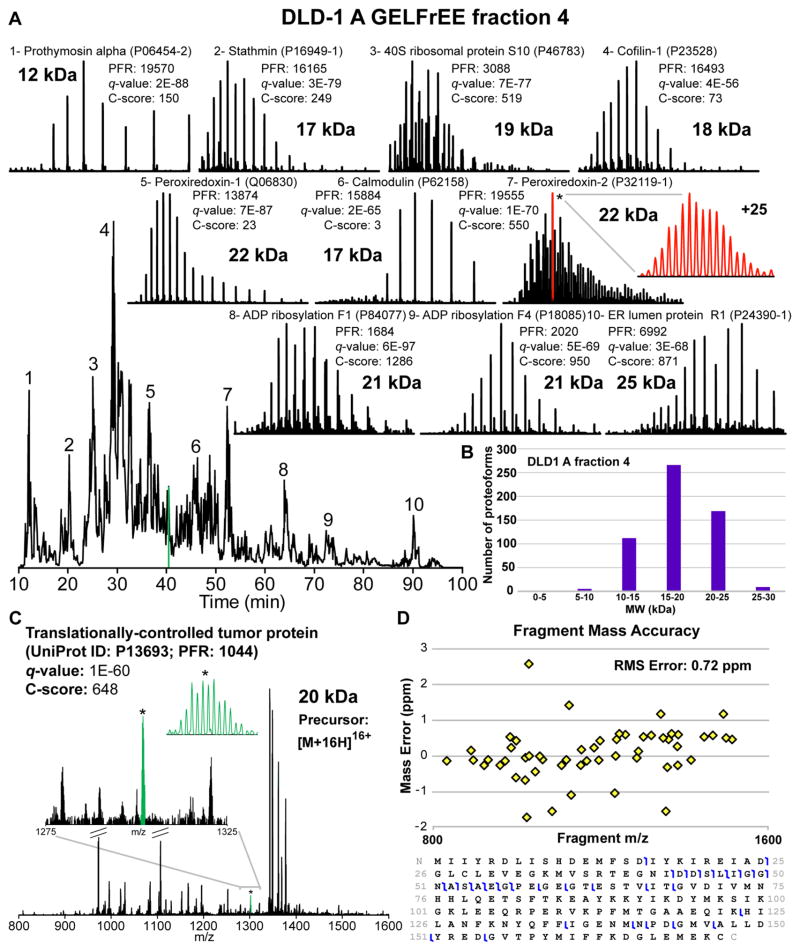
Figure 2.
LC–MS/MS of a single injection of GELFrEE fraction at 21 T. Data from DLD-1 A (Sample Set 1) GELFrEE fraction 4. (A) Total ion chromatogram (TIC). Ten example identifications are indicated (with UniProt and PFR numbers) along with single-scan broadband mass spectra, q-values, and C-scores. (B) Histogram depicting the molecular weight distribution of proteoforms identified in the fraction; 248 unique UniProt entries (observed as 561 proteoforms) were detected at a 1% FDR in this single LC–MS/MS analysis. (C) Single-scan CID MS2 spectrum taken at ~41 min (green label in TIC shown in panel A) identified as translationally controlled tumor protein, p23. (D) Top: fragment mass error (ppm) versus m/z and sequence coverage obtained from (C). Bottom: 54 fragments were matched to the putative sequence within a 10 ppm mass tolerance (RMS error 0.72 ppm, S/N ≈ 500–5:1), yielding ~17% sequence coverage.

