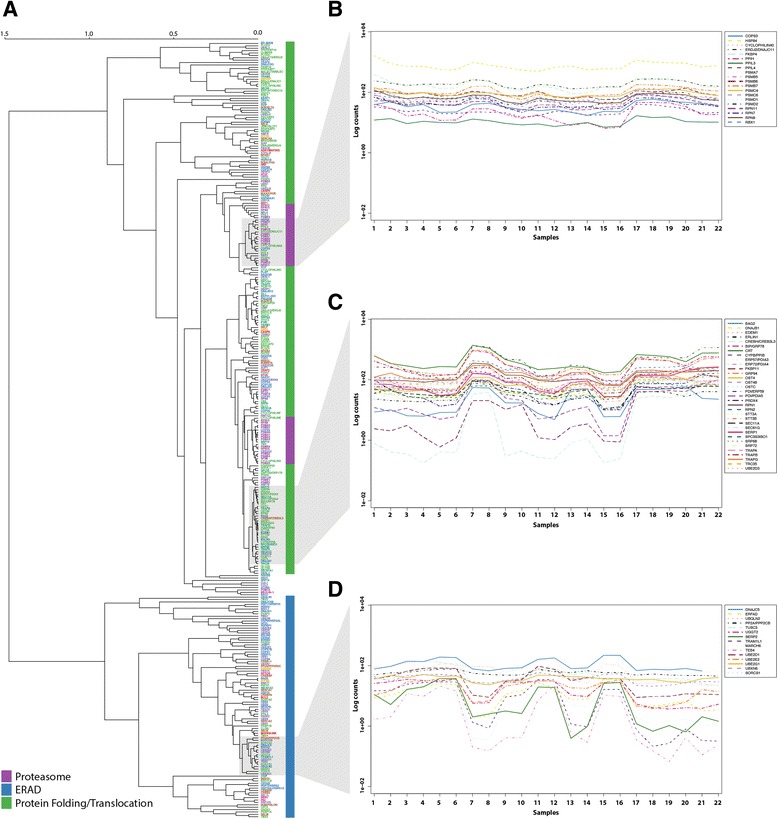
Fig. 2.

Hierarchical cluster analysis with average-linkage of mouse expression levels. a Dendrogram representing the hierarchical clustering of the gene expression levels of the components from the subsystems of ERAD, PF, proteasome, and translocation. Vertical colour bar: Purple, Proteasome; Blue, ER associated degradation (ERAD); Green, Protein folding (PF) and translocation. b Gene expression levels across all samples within proteasome. c Gene expression levels across all samples within genes with the functional annotation protein folding. d Gene expression levels across all samples within genes related to the ERAD. Blue, ER associated degradation (ERAD); Green, Protein folding (PF) and translocation; Purple, Proteasome. 1: CNS_e11.5-1, 2: CNS_e11.5-2, 3: CNS_e14-1, 4: CNS_e14-2, 5: CNS_e18-1, 6: CNS_e18-2, 7: Placenta_8w-1, 8: Placenta_8w-2, 9: Limb_e14.5-1, 10: Limb_e14.5-2, 11: Wholebrain_e14.5-1, 12: Wholebrain_e14.5-2, 13: Bladder_8w-1, 14: Bladder_8w-2, 15: Cerebellum_8w-1, 16: Cerebellum_8w-2, 17: Liver_e14-1, 18: Liver_e14-2, 19: Liver_e14.5-1, 20: Liver_e14.5-2, 21: Liver_e18-1, 22: Liver_e18-2
