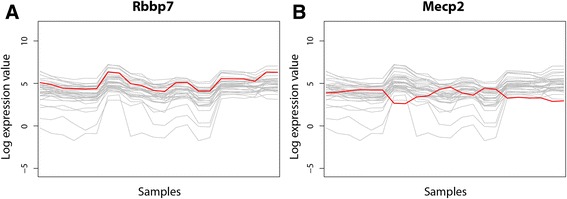
Fig. 3.

Spearman correlated expression profiles. Expression profiles correlated by Spearman correlation coefficient to the selected protein folding components from Fig. 2c. a Expression profile of correlated gene Rbbp7 (red) across all mouse samples visualised with the expression profiles of Fig. 2c. b Expression profile across all mouse samples of the gene Mecp2 (red) correlated by squared Spearman coefficient visualised with the expression profiles of Fig. 2c
