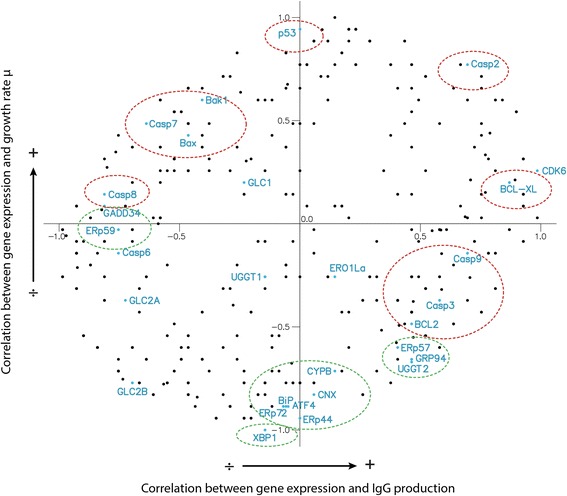
Fig. 5.

Components of the secretory network gene expression correlated with growth and protein production. The Spearman correlation coefficient is calculated for gene expression level to both growth rate and IgG production rate. Each dot marks a component of the secretory network. The highlighted points in blue are previously described generic targets. A Green circle indicates known targets associated with protein folding and UPR. Red circles indicate known targets associated with activation or inhibition of apoptosis
