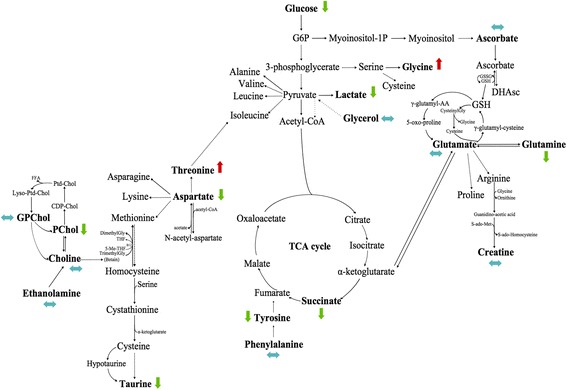
Fig. 4.

Impact of neoadjuvant chemotherapy on healthy tissue (PP). PP with neoadjuvant chemotherapy-related samples (n = 8) were compared to PP samples with no neoadjuvant chemotherapy (n = 9). Metabolic network analysis according to ADEMA results. The red, green, and blue arrows, respectively, indicate the metabolites that are predicted to increase, decrease, or remain stable in the population who received neoadjuvant chemotherapy
