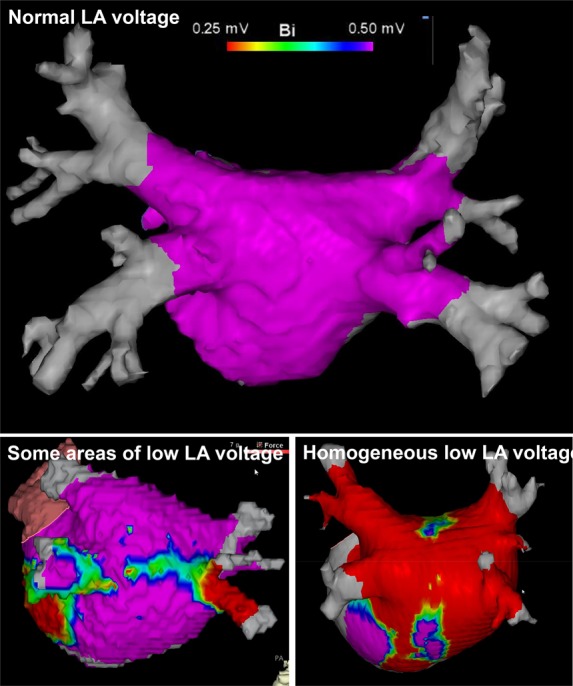
Figure 3.

Examples of left atrial voltage maps (view onto the posterior left atrium) showing normal left atrial voltage (upper panel), confined areas of low left atrial voltage (lower left panel), and homogeneous reduction of left atrial electrogram voltage (lower right panel). Purple colour indicates areas with normal (>0.5 mV) amplitude of bipolar electrograms, red areas with low (≤0.2 mV) left atrial voltage.
