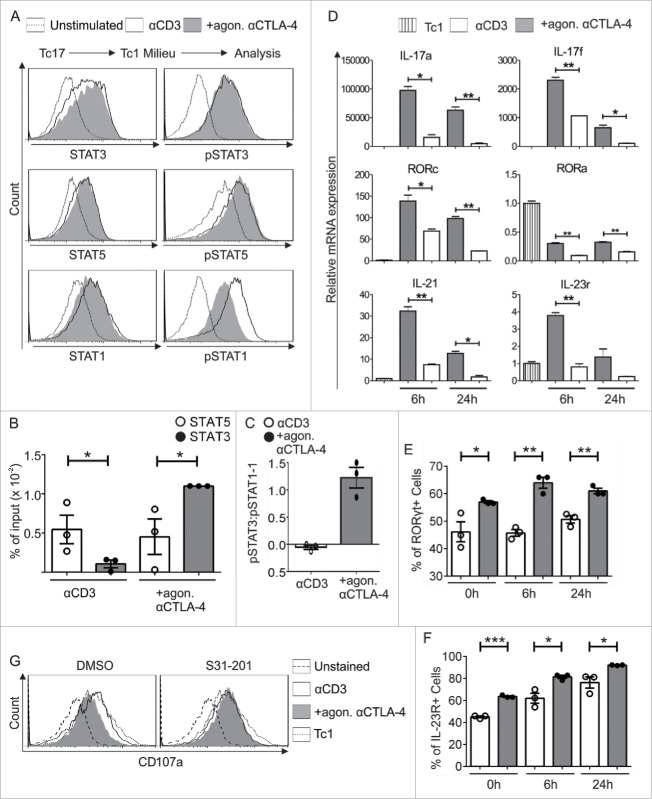
Figure 6.
CTLA-4-regulated STAT phosphorylation determines Tc17 plasticity. (A) Tc17 cells were re-activated in a Tc1 environment for 24 h (as described in Fig. 5A), harvested, and analyzed for the expression of the total and phosphorylated forms of STAT3, STAT1 and STAT5. The data are from a single experiment that is representative of two independent experiments. (B) ChIP analysis of Tc17 cells that were re-stimulated with Tc1-inducing cytokines for 24 h. The re-activated Tc17 cells were stimulated with IL-6+IL-23 or IL-2 for 30 min, and the protein–DNA interactions were crosslinked with formaldehyde and immunoprecipitated with anti-STAT3 or anti-STAT5. The bound DNA was purified and amplified by quantitative PCR with primers designed for the IL-17a promoter site. The results are presented relative to the input DNA. The data are representative of three independent experiments. (C) STAT3 and STAT1 phosphorylation levels in the re-stimulated cells were normalized to those in unstimulated cells, and the pSTAT3/pSTAT1 ratio was compared among cells that were crosslinked with anti-CD3 in the presence or absence of CTLA-4. The data are representative of three independent experiments. (D) Tc17 cells were harvested on day 3 after primary stimulation (considered 0 h before re-stimulation), re-stimulated as described in (A), and harvested at the indicated time points. The harvested cells were lysed, RNA was extracted, and RT was used to synthesize cDNA. The expression levels of the indicated genes relative to the housekeeping gene HPRT are shown as the mean ± SEM of duplicates from a single experiment that is representative of three experiments. (E, F) Tc17 cells were stimulated as in (D) and analyzed for the expression of (E) RORγt and (F) IL-23R by flow cytometry at the indicated time points. The data are representative of three independent experiments. (G) 3-d-cultured Tc17 cells in the presence (S31–201) or absence (DMSO) of STAT3 inhibitor were re-stimulated as in (A) and analyzed for the expression of degranulation-associated surface molecule CD107a on CD8+ T cell. The data are from a single experiment that is representative of three independent experiments. The error bars denote ± SEM. ***p < 0.001, **p < 0.01, *p < 0.05, n.s.: not significant, unpaired t-test.

