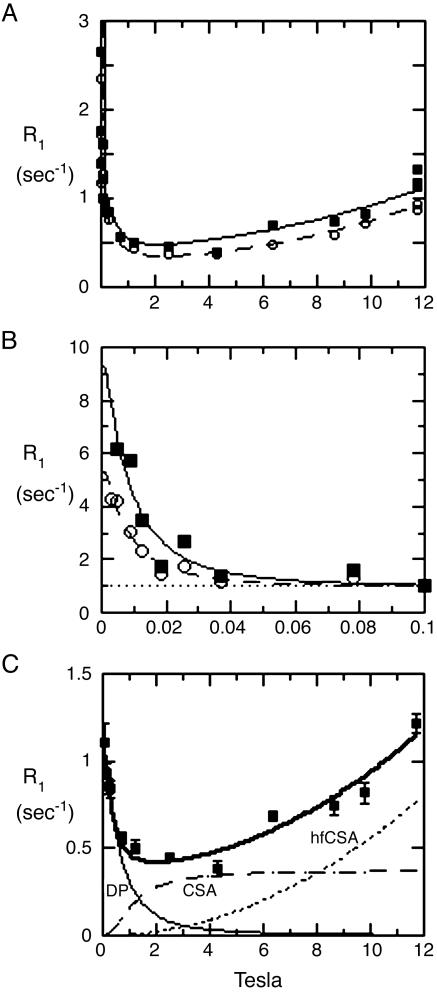
Fig. 2.
Relaxation rates of the 31P nuclear spins of each phospholipid in sonicated unilamellar vesicles containing a 1:1 mixture of POPC (▪) and DOPMe (○). The NMR peaks of the two species are well resolved and were identified from prior studies. (A) The entire data set is plotted at a gain too high for the lowest-field points, but that shows the high-field data most clearly. (B) Horizontally expanded plot of the lowest-field points at suitable lower gain. Note that the definite differences between the two species in rates in B are larger than the differences between them in A. Note also the well defined baseline (dotted line) in B, of ≈1 sec–1, that is subtracted in data analysis, as described in Materials and Methods. The theoretical curves are obtained from a fit as described in Materials and Methods.(C) The data taken on POPC above 0.1 T were fitted to a standard theoretical model, as described (13). The dotted curves marked CSA, and hfCSA are approximate contributions to the relaxation of the nuclear spin due to its CSA, which is relatively unimportant for the present article except as a source of error. The thin solid line at the bottom left marked DP (for dipolar) is an estimate of the contribution to the relaxation rate from the magnetic dipolar interaction of the phosphorus spin with nearby proton spins. The upper thick solid curve is the sum of these three contributions. The DP curve has two adjustable parameters, a correlation time and an effective distance between the phosphorus and the nearby protons. The two theoretical CSA curves have two additional adjustable parameters that determine the vertical scale of each.

