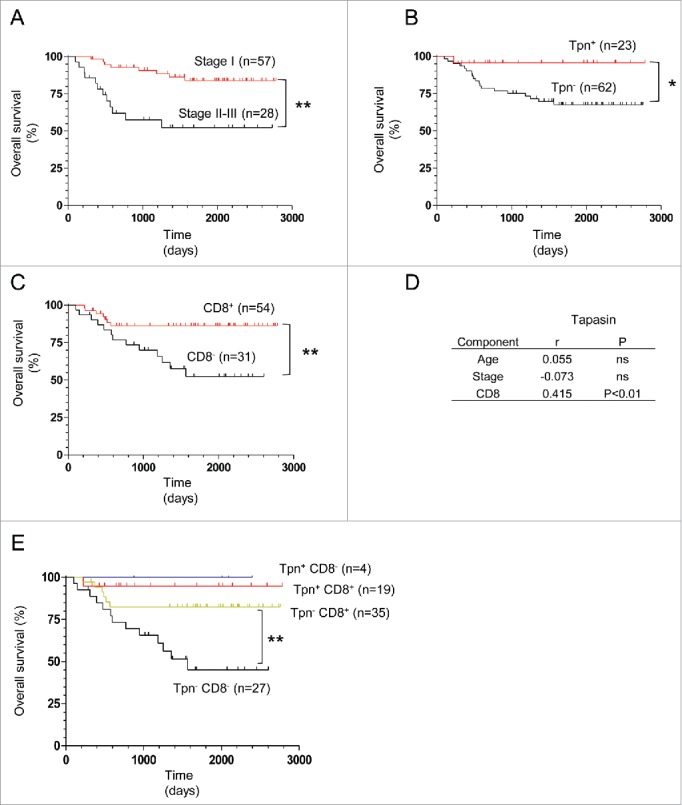
Figure 2.

Correlation of tapasin expression or CD8+ T-cell infiltration with NSCLC patient survival. (A, B, C, and E) Kaplan–Meier survival analysis of clinical stages, tapasin expression, CD8+ T-cell infiltration and combined scores of tapasin expression and CD8+ T-cell infiltration (positive, score 2; negative, score 1 or 0). p-values are calculated using the log-rank test. (D) Correlation (r) of tapasin expression scores with ages, stages and CD8+ T-cell infiltration scores. ns, not significant. p-values are calculated using the Spearman rank test.
