
Figure 2.
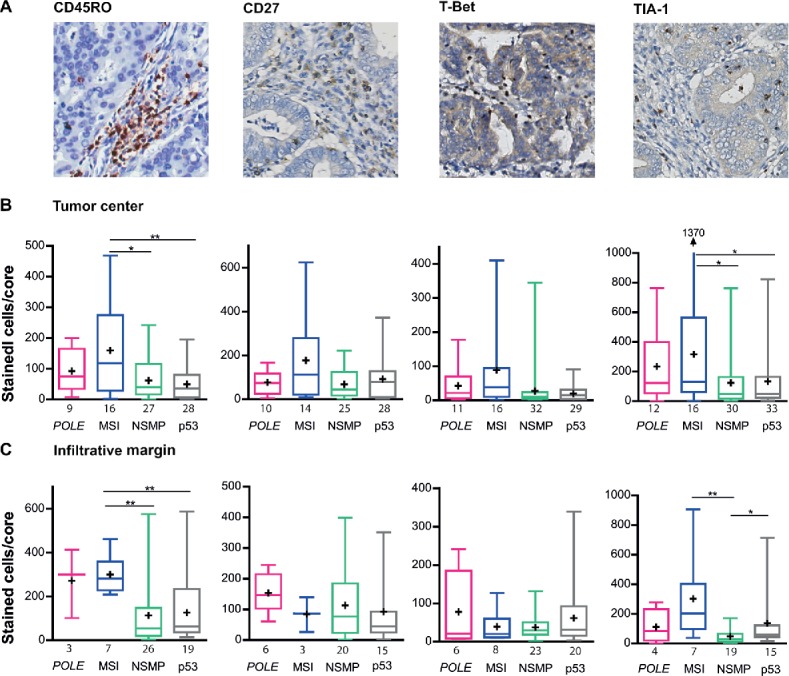
Infiltration of TIA-1+, T-Bet+, CD20+ and CD45RO+ cells in POLE-mutant, MSI, NSMP and p53-mutant endometrial cancers. (A) Representative immunohistochemical stainings of CD45RO+, CD27+, T-Bet+ and TIA-1+ cells. (B) Average number of positively stained intratumoral cells for each of the markers in the above panel, counted per core within the tumor center, corrected for the number of cells present. (C) Average number of positively stained cells for each of the markers in the above panel, counted per core within the infiltrative margin, corrected for the number of cells present. The numbers of cases analyzed for each molecular subgroup are listed below the x-axis. Boxes represent the interquartile range (IQR), with the upper whisker indicating the 75th percentile and the lower whisker the 25th percentile. The median and mean values are indicated by a horizontal line and cross, respectively. Abbreviations: POLE, POLE-mutant; MSI, microsatellite unstable; NSMP, no specific molecular profile; p53, p53-mutant. *p < 0.05, **p < 0.01, ***p < 0.001.