
Figure 3.
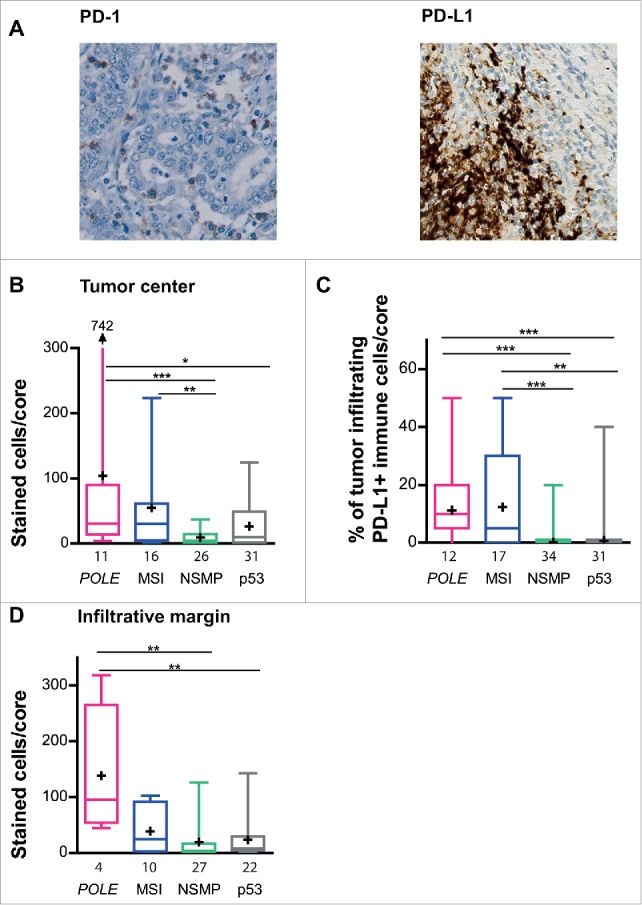
Infiltration of PD-1+ and PD-L1+ cells in POLE-mutant, MSI, NSMP and p53-mutant endometrial cancers. (A) Representative immunohistochemical stainings of PD-1+ and PD-L1+ cells. (B) Average number of PD1+ cells counted per core within the tumor center, corrected for the number of cells present. (C) Percentage of PD-L1+ tumor-infiltrating immune cells within the tumor core and infiltrative margin core. (D) Average number of PD1+ stained cells counted per core within the infiltrative margin. The numbers of cases analyzed for each molecular subgroup are listed below the x-axis. Boxes represent the interquartile range (IQR), with the upper whisker indicating the 75th percentile and the lower whisker the 25th percentile. The median and mean values are indicated by a horizontal line and cross, respectively. Abbreviations: POLE, POLE-mutant; MSI, microsatellite unstable; NSMP, no specific molecular profile; p53, p53-mutant. *p < 0.05, **p < 0.01, ***p < 0.001.