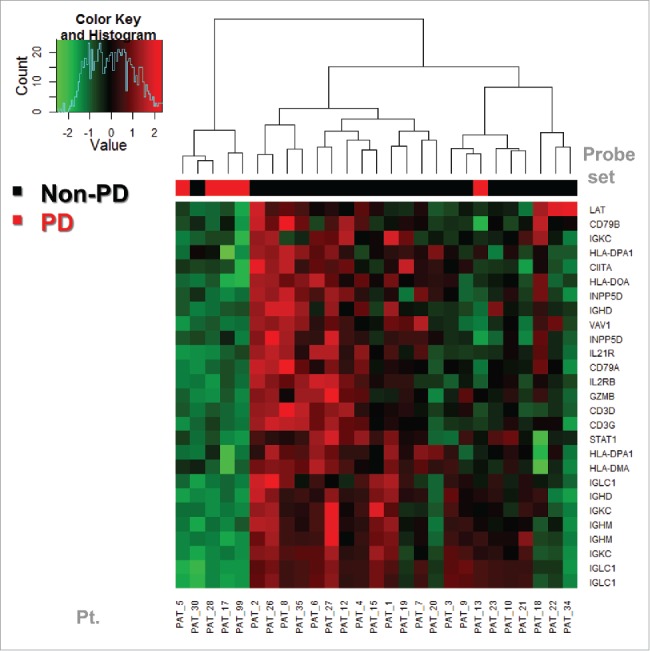
Figure 3.

Baseline expression prediction of PD (disease progression as assessed at week 6 by PET-CT preoperatively) vs. non-PD. We evaluated correlation with PD vs. non-PD, using only the probe sets that are significantly differentially expressed between the two groups (27 probe sets from 19 genes). Hierarchical clustering was performed generating a heat map of low expression vs. high expression that correlated well with the PD vs. non-PD status of the patients. The PD group was found to have a lower expression of these genes. One PD and one non-PD subjects were in the wrong group, although by RFS they appeared to cluster within similar prognosis groups. These findings supported the investigation of relapse-free survival (RFS) as a more relevant clinical endpoint as shown in Fig. 4.
