
Figure 4.
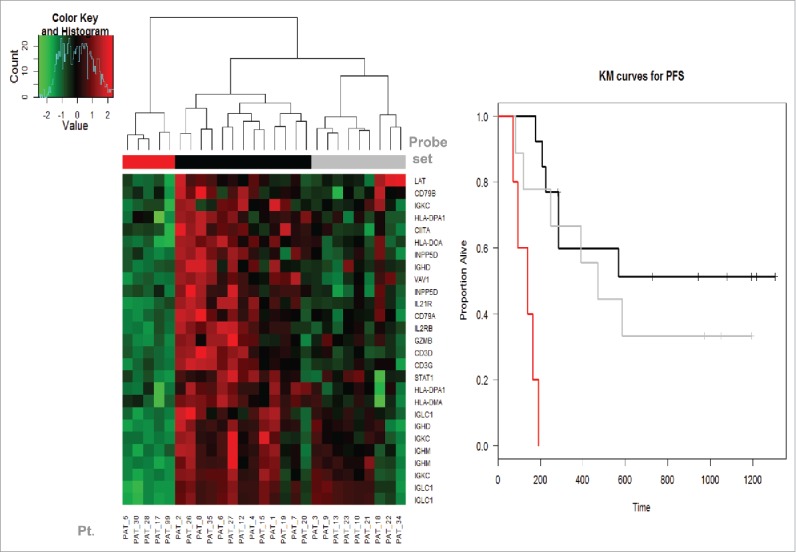
The Kaplan–Meier (KM) plot of RFS by the expression levels of PD (disease progression as assessed at week 6 by PET-CT preoperatively) and non-PD groups. We noticed a sub-group within the high expression (non-PD group) group that had a genomic expression profile in-between the very low expression (PD group) and the other high expression (non-PD subgroup). KM curve showed that this subgroup (in gray) has slightly worse RFS than the other high expression subgroup (in black). Both had significantly lower risk of relapse than the low expression (PD) group (in red).