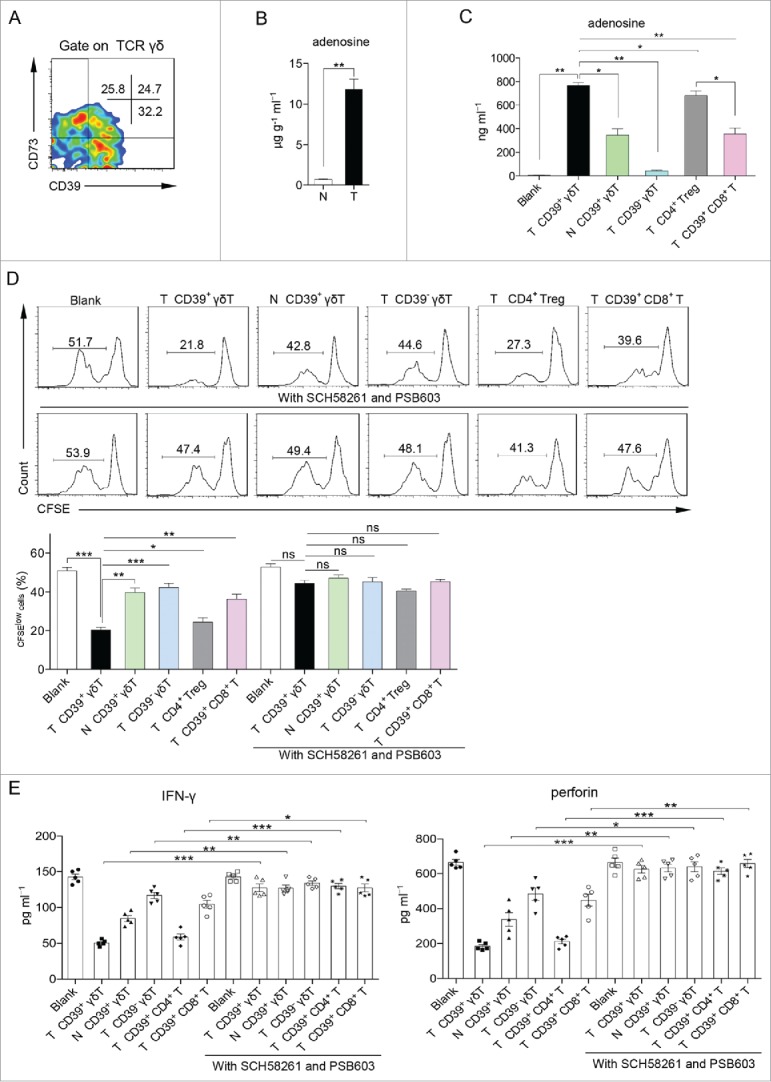
Figure 4.

CD39+ γδT regulatory cells (CD39+ γδTreg) exhibit direct immunosuppression via the adenosine-mediated pathway. (A) Representative flow cytometric analysis of CD39 and CD73 expression on γδT cells in tumor tissue. Flow plots were gated on CD45+ CD3+ TCRγδ+ cells. (B) Concentrations of adenosine in the supernatants from 1 g of tumor and paired normal tissues were detected by HPLC. N: normal tissue; T: tumor tissue. Data are shown as mean ± SEM; n = 5; **p < 0.01. (C) HPLC assay to measure adenosine concentrations in the supernatants of Fig. 3A on day 6. N: normal tissue; T: tumor tissue. Data are shown as mean ± SEM; n = 5; *p < 0.05; **p < 0.01. (D) Sorted CD39+ γδT, CD39− γδT, CD4+ Treg, CD39+ CD8+ T cells from tumor tissue and CD39+ γδT cells from paired normal tissue were in vitro co-cultured with CFSE-labeled allogeneic CD3+ T cells in the presence of CD3 and CD28 mAbs, pretreated with or without A2A (SCH58261) and A2B (PSB603) adenosine receptor antagonists. CD3+ T-cell proliferation was evaluated on day 6 by FCM (upper panel). Bar diagram summarizes the percentages of proliferated cells (CFSElow) in CD3+ T cells (lower panel). N: normal tissue; T: tumor tissue. Data are shown as mean ± SEM; n = 5; ns: no significance; *p < 0.05; **p < 0.01; ***p < 0.001. (E) Sorted CD39+ γδT, CD39− γδT, CD39+ CD4+ T, CD39+ CD8+ T cells from tumor tissue and CD39+ γδT cells from paired normal tissue were in vitro co-cultured with allogeneic CD4+ and CD8+ T cells in the presence of CD3 and CD28 mAbs, pretreated with or without A2A (SCH58261) and A2B (PSB603) adenosine receptor antagonists. IFNγ (left panel) or perforin (right panel) levels in the supernatants were detected on day 6 by ELISA. N: normal tissue; T: tumor tissue. Data are shown as mean ± SEM; n = 5; *p < 0.05; **p < 0.01; ***p < 0.001; ****p < 0.0001.
