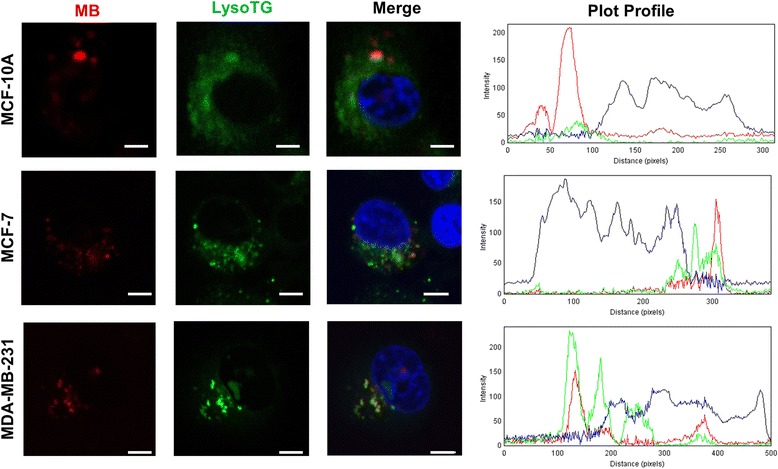
Fig. 5.

MB localizes in the lysosomes of MCF-10A, MCF-7 and MDA-MB-231 cells. Confocal microscopy images of cells simultaneously incubated with LysoTracker green (LysoTG, green), MB (red) and Hoechst 33342, for nuclei staining (blue). Plot profiles quantify the intensity of red, green and blue fluorescence from a straight line in the middle of the cell. [MB] = 20 μM; [LysoTG] = 300 nM; nucleus (HO 3334 = 300 nM). Scale Bar: 10 μm
