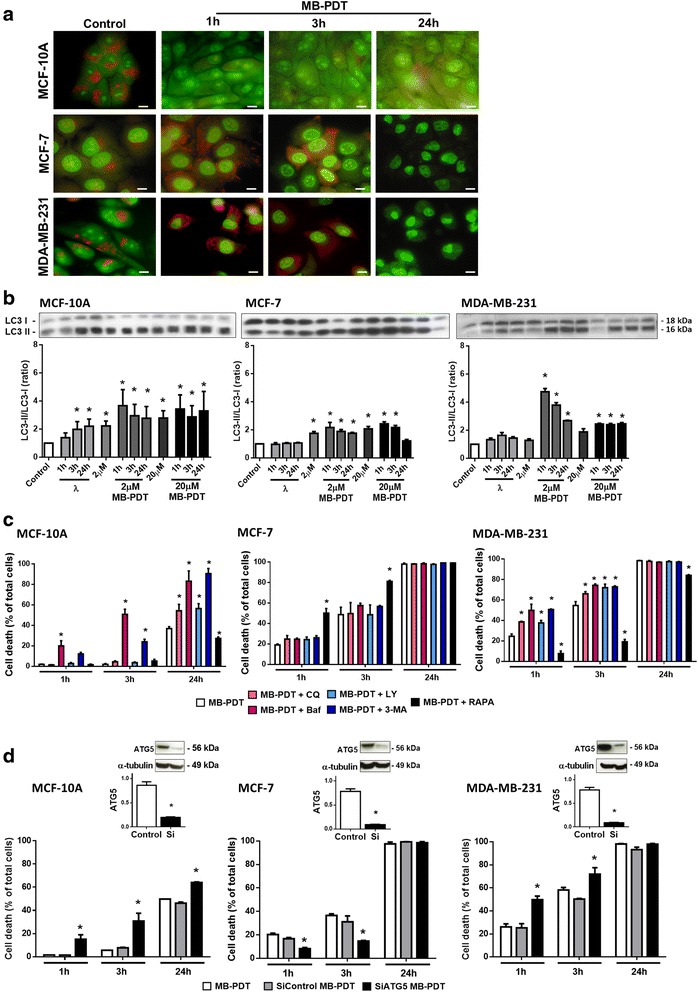
Fig. 6.

MB-PDT-induced autophagy leads to cytoprotection (MDA-MB-231 and MCF-10A) or cell death (MCF-7). (a) Representative images of acidic vesicle formation in cells subjected to MB-PDT after 1 h, 3 h or 24 h or not treated (control). Upper panels: MCF-10A; middle panels: MCF-7; and lower panels: MDA-MB-231. Scale bar: 10 μm. (b) WB analysis of LC3-II/LC3-I ratio after MB-PDT treated cells with 2 or 20 μM MB, irradiated only after 1 h, 3 h or 24 h, incubated with 2 or 20 μ MB in the dark or not treated (control). Immunoblots shown are representative results. The corresponding bar graph results from densitometry analysis from all blots. Results are presented as mean ± s.e.m., (n = 3); * p < 0.05 versus control. (c) Viability time curves with 2 μM (MDA-MB-231) or 20 μM (MCF-7 and MCF-10A) of MB obtained upon 1 h, 3 h and 24 h post-irradiation in the presence or in the absence of chloroquine (CQ), bafilomycin (Baf), LY294002 (LY), 3-MA or rapamycin (RAPA). (n = 3 independent experiments). * p < 0.05 versus MB-PDT. (d) Viability time curves of cells subjected or not to ATG5 silencing and then MB-PDT were obtained upon 1 h, 3 h and 24 h (n = 3 independent experiments). * p < 0.05 versus MB-PDT. Upper panels: WB analysis of ATG5 protein levels. Immunoblots shown are representative results. The corresponding bar graph results from densitometry analysis from all blots. Results are presented as mean ± s.e.m, (n = 3 independent experiments); * p < 0.05 versus control
