
Figure 1.
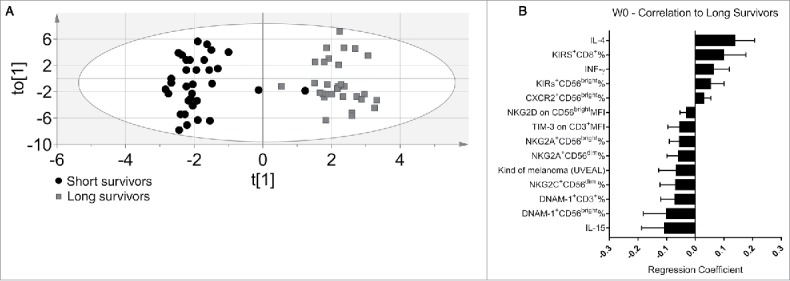
Discriminant analysis and immunoprofile of melanoma patients before the treatment (W0). (A) Discriminant analysis: Gray squares = long survivors (31), 12 mo or more. Black circles = short survivors, <12 mo (33). Horizontal axis = predictive component. Vertical axis = Orthogonal component not related to difference between groups. Ellipse = Hotelling's T2 95% confidence interval limit. (B) The 14 most significant variables correlated with long survival at the start of treatment. Error bars = 95% confidence intervals. Positive correlation to long survival means negative correlation to short survival, and vice versa.